Where Your Image Goes: An Image to Prompt Tool Sees 192 × 192 Pixels
The path your file takes, what is destroyed before anything is measured, and which of the numbers survive the resize intact.
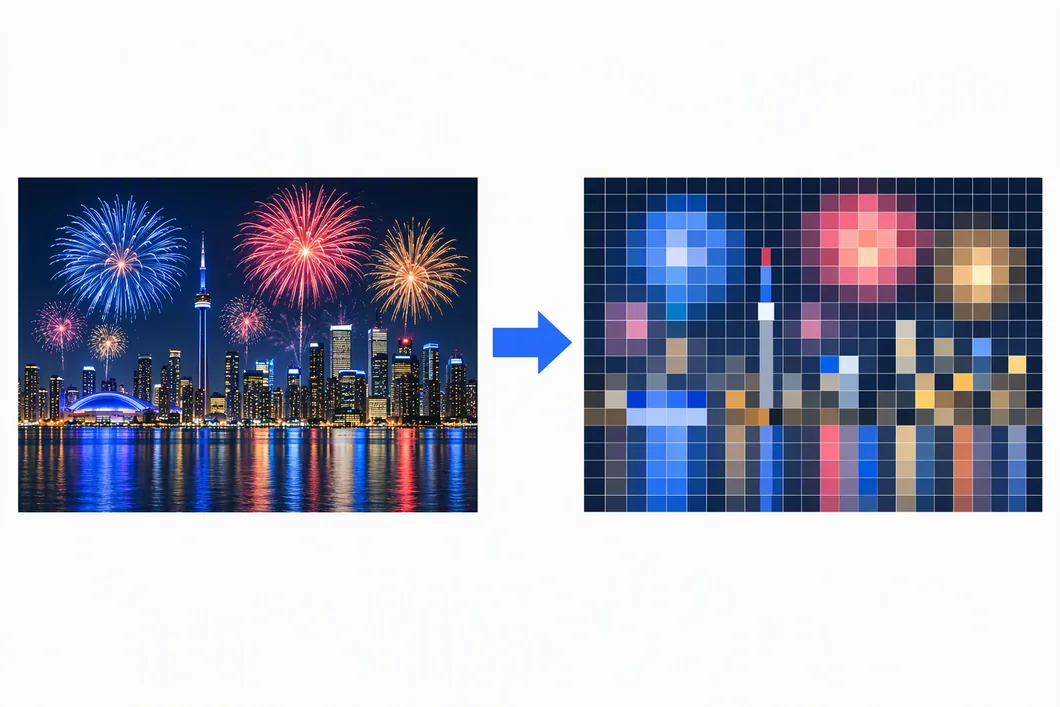
Your image never leaves your browser. Before a single thing is measured, it is drawn into a 192 × 192 canvas and read back as a grid of numbers — 36,864 pixels, 147,456 bytes. That grid is the only thing any part of this image to prompt tool ever looks at. Your filename, your file size, your camera metadata and your transparency are read by no line of it. The only two values carried over from the original file are its width and height, and they are used for exactly one thing: the aspect ratio.
There is also nothing in the code that could carry it anywhere. Searching every file in the library — 1,064 lines in total — for fetch(, XMLHttpRequest, WebSocket, sendBeacon, EventSource, http://, localStorage, sessionStorage and document.cookie returns exactly two hits: the clipboard call behind the Copy button, and the project URL in the README. Add URL.createObjectURL and you get a third — and that one builds a local handle to the file you just picked, which is the opposite of a request.
The whole path is three functions
This is src/browser.js, uncut. Create an off-screen canvas, draw the image into it at a fixed size, read the pixels back:
export const SAMPLE_SIZE = 192;

export function drawToCanvas(img, size = SAMPLE_SIZE) {
  const cv = document.createElement('canvas');
  cv.width = size; cv.height = size;
  const ctx = cv.getContext('2d', { willReadFrequently: true });
  ctx.drawImage(img, 0, 0, size, size);
  return ctx.getImageData(0, 0, size, size);
}
From there the bytes go to analyzeRGBA, which does arithmetic over them, and the resulting numbers go to describe and compose. Nothing in that chain holds a reference to your file. The live build carries the same constant — var W = 192, H = 192 in the page script.
The comment above that function states the intent plainly: "The image never leaves the page. There is no fetch, no upload, no endpoint. Sampling at 192x192 keeps the cost flat regardless of input size — a 6000px photo and a 300px thumbnail take the same time to measure."
What the resize destroys before anything is measured
Three images — a night fireworks shot, a strongly backlit meadow, and a code screenshot — and what the 192 grid does to them:
| Image | Original | Pixels in | Pixels measured | Kept | One cell covers |
|---|---|---|---|---|---|
| night-fireworks.png | 640×360 | 230,400 | 36,864 | 16.00% | 3.33 × 1.88 px |
| strong-backlight.png | 640×360 | 230,400 | 36,864 | 16.00% | 3.33 × 1.88 px |
| text-screenshot.png | 800×450 | 360,000 | 36,864 | 10.24% | 4.17 × 2.34 px |
Anything thinner than about two to four original pixels — a hairline border, a 1px underline, a thin outline — is averaged into its neighbours before a single measurement runs. It was in your file. It is not in the numbers.
What the resize does to the numbers
Running the analyser twice over each image — once on the full-resolution buffer, once on the 192 grid the browser actually hands it — shows which measurements are robust and which are not:
| Image | meanL full → 192 | stdL full → 192 | edge full → 192 | Detail phrase |
|---|---|---|---|---|
| night-fireworks.png | 34.41 → 34.51 | 51.79 → 46.93 | 25.63 → 22.50 | highly detailed (both) |
| strong-backlight.png | 73.76 → 73.95 | 80.64 → 80.36 | 9.60 → 13.02 | moderate detail (both) |
| text-screenshot.png | 35.85 → 35.95 | 17.94 → 13.68 | 5.12 → 5.14 | clean and minimal (both) |
Three things fall out of that table:
- Brightness survives.
meanLmoved by at most 0.19 of 255 — 34.41 → 34.51, 73.76 → 73.95, 35.85 → 35.95. Averaging a region does not change how light it is on the whole. - Contrast is flattened, but by how much depends on the picture.
stdLfell 23.7% on the code screenshot (17.94 → 13.68), 9.4% on the fireworks (51.79 → 46.93) and 0.4% on the backlit meadow (80.64 → 80.36). A frame that already swings between deep shadow and bright highlights keeps most of its spread when you average it; a flat dark frame loses more. - Edge density has no fixed direction. It fell 12.2% on the fireworks (25.63 → 22.50), rose 35.6% on the backlit meadow (9.60 → 13.02) and barely moved on the code screenshot (5.12 → 5.14). The fireworks lose edges because the fine trails are thin and get averaged away; the meadow gains them because coarse dark foreground and bright sky get folded into neighbouring cells that now differ sharply.
The same alignment explains a result that looks like a contradiction until you have seen it: mirroring a photograph left to right changes none of these numbers, yet the palette clause still moved on 10 of 40 files, because flipping the file shifts which source columns fall into each cell of the 192 grid. That is one of six one-click edits that show what an image to prompt tool is actually reading, each of them scored over forty real files.
None of the three crosses a threshold. The detail cut-off in describe.js is edge > 7. The fireworks sit at 25.63 on the full buffer and 22.50 on the 192 grid — well above the line in both cases, so the phrase stays highly detailed with intricate texture. The code screenshot sits at 5.12 and 5.14 — below it in both, so it stays clean and minimal, smooth surfaces. The backlit meadow moves furthest in relative terms, 9.60 → 13.02, and still lands on the same side. On these three the resize moves the numbers without ever changing the wording.
On the same basis: the measurement table in what an image to prompt tool measures and the grid above are both computed on the 192 × 192 canvas, which is what the live tool measures. The figures in the two are directly comparable.
Where the colours go
Averaging does not just soften detail — it desaturates slightly, and it changes which colour names survive. These are the top-five palettes, before and after:
| Image | Palette at full resolution | Palette at 192 × 192 |
|---|---|---|
| night-fireworks.png | navy 77.3%, charcoal 6.0%, grey 5.3%, slate 4.1%, silver 2.5% | navy 74.4%, grey 8.7%, slate 8.3%, silver 3.5%, black 1.6% |
| strong-backlight.png | black 57.6%, charcoal 12.7%, silver 11.5%, white 8.7%, olive 5.3% | black 57.6%, charcoal 12.7%, silver 11.8%, white 8.3%, olive 5.3% |
| text-screenshot.png | charcoal 93.4%, forest green 4.9%, silver 0.9%, grey 0.5%, slate 0.2% | charcoal 91.9%, forest green 7.0%, slate 1.1%, grey <0.1% |
If a colour accent matters to your prompt, it has to occupy real area in the frame — and even then it can move in either direction. On the fireworks shot, charcoal at 6.0% of the frame drops out of the top five entirely after the resize while grey more than doubles, 5.3% → 8.7%. On the code screenshot, forest green goes the other way, 4.9% → 7.0%. The dominant entry barely shifts in any of the three: navy 77.3% → 74.4%, black 57.6% → 57.6%, charcoal 93.4% → 91.9%. It is the small shares that are up for grabs.
Transparency is not read at all
analyzeRGBA reads data[i*4], data[i*4+1] and data[i*4+2] — red, green, blue. It never reads data[i*4+3]. And drawToCanvas puts nothing behind the image first: no fillRect, no background colour. So the pixels your image leaves untouched stay transparent, and a transparent pixel carries RGB 0,0,0.
Two 16 × 16 buffers, half the frame transparent black (RGB 0, alpha 0) and half opaque white:
- transparent half at RGB 0, alpha 0 →
meanL= 127.50 of 255 - same buffer, invisible half changed to RGB 255, alpha still 0 →
meanL= 255.00
The alpha byte made no difference either time. A transparent PNG background is counted as black. If you export a logo on transparency, expect the prompt to describe dark surroundings; fill the background before you drop it in.
The aspect ratio is two integers, and that is all that is left of your file
Here is the only place the original dimensions enter the measurement, in analyze.js:
const nw = (natural && natural.w) || W;
const nh = (natural && natural.h) || H;
In the browser path those come from img.naturalWidth and img.naturalHeight. Everything else is measured off the 192 grid. The two integers produce ar and arParam, and then the framing phrase — and they have to be passed in explicitly. Omit the natural argument and all three images report 1:1 and square 1:1, because the buffer actually being measured is 192 × 192. The aspect ratio you are shown is a fact about your original file carried past the resize by hand, not something measured from the pixels under analysis.
What is never read
- Your filename. The file handler checks
file.type.startsWith('image/')and nothing else;file.nameappears nowhere in the library. Renaming a file cannot change its prompt. - Your file size. Never read. A 51 KB PNG and an 88 KB PNG are measured on the same grid.
- EXIF. No metadata parser, no orientation tag, no GPS, no camera make. The two dimensions are all that is taken.
- Anything outside the pixels. No sign-up, no counter, no analytics on the tool.
What this means when you choose an image
- Resolution above 192 px buys you nothing. A 6000 px photo and a 300 px thumbnail are measured on the same grid, in the same time, and neither one contributes more than 36,864 pixels.
- Crop instead of trusting the detail. If you want the texture of one region described, crop to that region first. That changes what fills the grid. Sending the full frame does not.
- Small colour accents have to be big to count. Below roughly half a percent of the frame they are averaged into grey.
- Transparent backgrounds read as black. Flatten before you analyse.
Checking any of this yourself
Open your browser's network tab, drop an image in and watch: no request fires when the image is measured. Every value behind every phrase is printed under the generated prompt, so if a sentence looks wrong you can find the number that produced it and argue with that number instead. And the measurement layer is public and MIT licensed — the constants quoted here are three lines of src/browser.js.
Separately from the tool: the page itself is served by a host and funded by advertising, and ad networks may set their own cookies. That is described in full on the privacy page, because it is the one place where something leaves your device.
For the numbers behind each phrase, see what an image to prompt tool measures. For what to do when the wording comes out wrong, see fixing a wrong image to prompt output. For turning a picture into something you can paste into a generator, see getting a usable AI image prompt from any picture.